5 差异表达基因[Differential Expressed Genes]
MA-plot
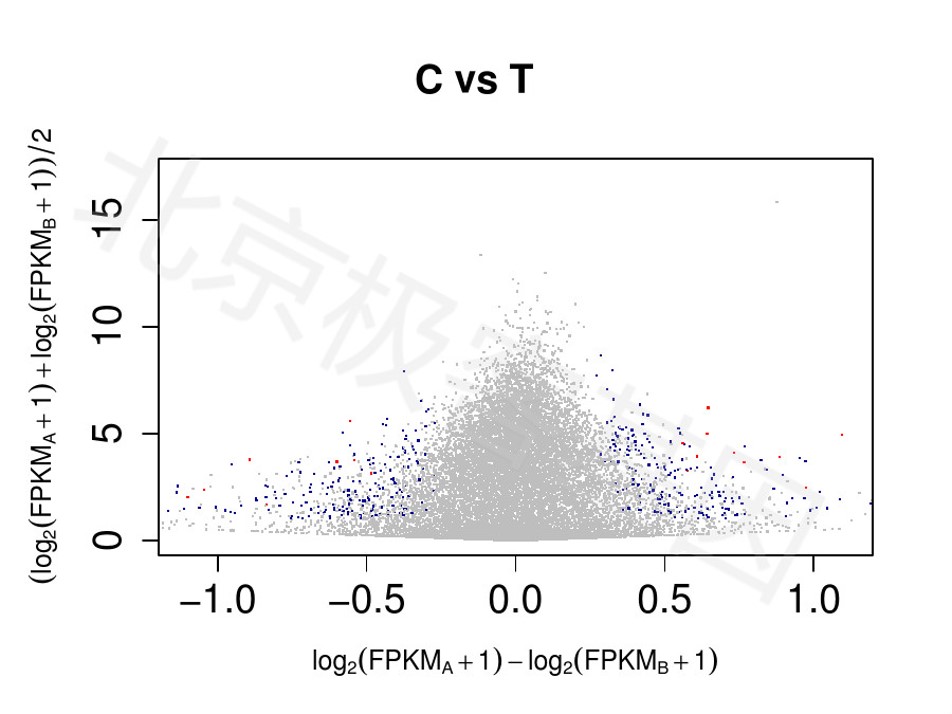
MA-plot 也称为 Bland-Altman plot ,主要应用在基因组数据可视化方面,实现数据分布情况的展示。该图将数据转换为M(对数比)和A(平均值),然后绘制这些值来可视化两个样本中测量值之间的差异。
An MA-plot is an application of a Bland–Altman plot for visual representation of genomic data. The plot visualises the differences between measurements taken in two samples, by transforming the data onto M (log ratio) and A (mean average) scales, then plotting these values.
图例[Figure legend]
每个点代表一个基因 。x轴的计算方法 \(log_2(\frac{FPKM_A+1}{FPKM_B+1})\),
y轴的计算方法 \(\frac{1}{2}[log_2(FPKM_A+1)+log_2(FPKM_B+1)]\)。
差异表达基因(Differentially expressed genes,DEGs) 标记为红色和蓝色,
红色是 (\(P \leq 0.001\) and \(FC\geq1.2\)) ,蓝色是(\(0.05 \geq P>0.001\) and \(FC\geq1.2\)) 。
Each point stands for a gene. The x-axis is calculated as \(log_2(\frac{FPKM_A+1}{FPKM_B+1})\), while the y-axis is calculated as \(\frac{1}{2}[log_2(FPKM_A+1)+log_2(FPKM_B+1)]\).
Differentially expressed genes (DEGs) are marked in red (\(P \leq 0.001\) and \(FC\geq1.2\)) and in blue (\(0.05 \geq P>0.001\) and \(FC\geq1.2\)).
火山图[Volcano plot]
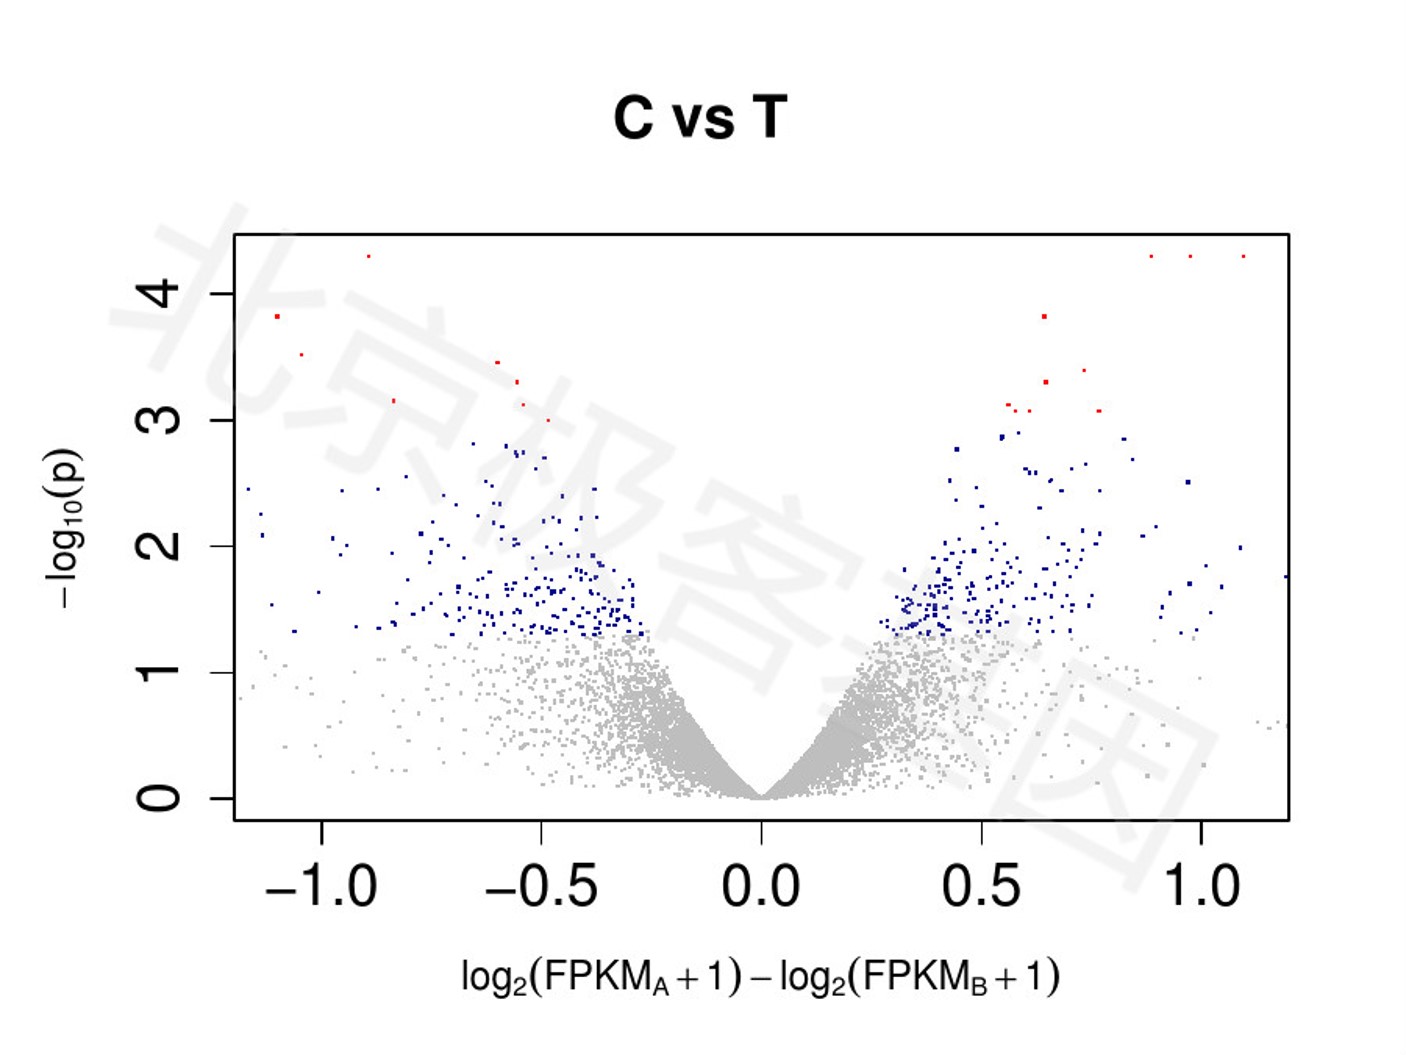
火山图 是一类散点图,可反映大量重复数据的集中变化情况。它绘制了表达倍数和显著性之间的关系。
A volcano plot is a type of scatter-plot that is used to quickly identify changes in large data sets composed of replicate data. It plots significance versus fold-change on the y and x axes, respectively.
图例[Figure legends]
每个点代表一个基因。 x轴为 \(log_2( \frac{FPKM_A+1}{FPKM_B+1})\), y轴为 \(log_{10}(p)\)。
颜色使用与 MA-plot 一致。
Each dot stands for a gene. The x-axis is calculated as \(log_2( \frac{FPKM_A+1}{FPKM_B+1})\), and y-axis is calculated as \(log_{10}(p)\).
Colors are used the same way as that of MA-plot.
DEGs 数目[Count of DEGs]
| A_vs_B | NO_DEG | NO_DEG_UpInA | NO_DEG_UpInB |
|---|---|---|---|
| C_vs_T | 401 | 197 | 203 |
分列信息[Column Description]
A_vs_B : 样品A和样品B之间的比较[The comparison between sample A and sample B]
NO_DEG : A 和 B 间差异表达基因 (DEG) b/w[Number of DEG (Differential Expression Gene) b/w A and B]
NO_DEG_UpInA : A 上调的差异表达基因[Number of DEG up-regulated in sample A]
NO_DEG_UpInB : B 上调的差异表达基因[Number of DEG up-regulated in sample B]
5.1 C vs. T
DEG 表格[DEG tables]
- 样本 C 高表达[High expressed in C]: DEG_C_vs_T.High_in_C.xls
- 样本 T 高表达[High expressed in T]: DEG_C_vs_T.High_in_T.xls
MA plot

Figure 5.1: MA-plot (C vs. T)
PDF 文件 : C_vs_T_MAplot.jpg
- 火山图[Volcano plot]

Figure 5.2: PV-FC plot (C vs. T)
PDF 文件 : C_vs_T_PV_FC.jpg
