6 GO 分析[GO Analysis]
基因本体论 ( Gene Ontology, GO )是基因功能分类体系,它由一组预先定义好的术语组成,这组术语对基因和蛋白质功能进行限定和描述。
The Gene Ontology project provides an ontology of defined terms representing gene product properties.
Ontology包括三个部分:
The ontology covers three domains:
- 细胞组分 (Cellular Component,CC),亚细胞结构、位置和大分子复合物,如核仁、端粒和识别起始的复合物等。
- 分子功能 (Molecular Function,MF),基因产物个体的功能,如与碳水化合物或ATP水解酶活性等。
- 生物过程 (biological process,BP), 分子功能的有序组合,达成更广的生物学功能,如有丝分裂和嘌呤代谢等
- Cellular Component (CC), the parts of a cell or its extracellular environment
- Molecular Function (MF), the elemental activities of a gene product at the molecular level, such as binding or catalysis
- biological process (BP), operations or sets of molecular events with a defined beginning and end, pertinent to the functioning of integrated living units: cells, tissues, organs, and organisms
方法[Method]
GO (Gene Ontology) 富集分析工具为 TopGO (v2.24.0).
GO (Gene Ontology) enrichment analysis was performed using TopGO (v2.24.0).
图例[Figure Legend]
GO 有向无环图[GO Node Graph]
有向无环图包括了前十个富集分析的基因功能,矩形代表这十个重要术语。 矩形颜色代表了显著性,范围从深红色 (最重要) 到亮黄色 (最不重要)。 对于每个节点,将显示一些基本信息。 前两行显示GO标识符和GO名称。 在第三行中显示原始p值。 第四行显示了重要基因的数量和注释到相应GO术语的基因总数。
The subgraph induced by the top 10 GO terms identified by TopGO for scoring GO terms for enrichment. Rectangles indicate the 10 most significant terms. Rectangle color represents the relative significance, ranging from dark red (most significant) to bright yellow (least significant).
For each node, some basic information is displayed. The first two lines show the GO identifier and a trimmed GO name. In the third line the raw p-value is shown. The forth line is showing the number of significant genes and the total number of genes annotated to the respective GO term.
GO 气泡图[GO Summary Graph]
气泡图显示了GO注释的富集结果。 x轴表示倍数变化,圆圈的数量是富集功能的数量,并且圆的大小与基因数量相关联。 圆的颜色表示显著性(红色是最显著的)。 Summary for top enriched GO items. The x-axis indicate the fold change. Number in circle the number of enriched genes, and size of circle is associated with gene number. Color of circle indicates the significance of enrichment (red is the most signicant).
6.1 C vs. T
- Biological Process (BP)
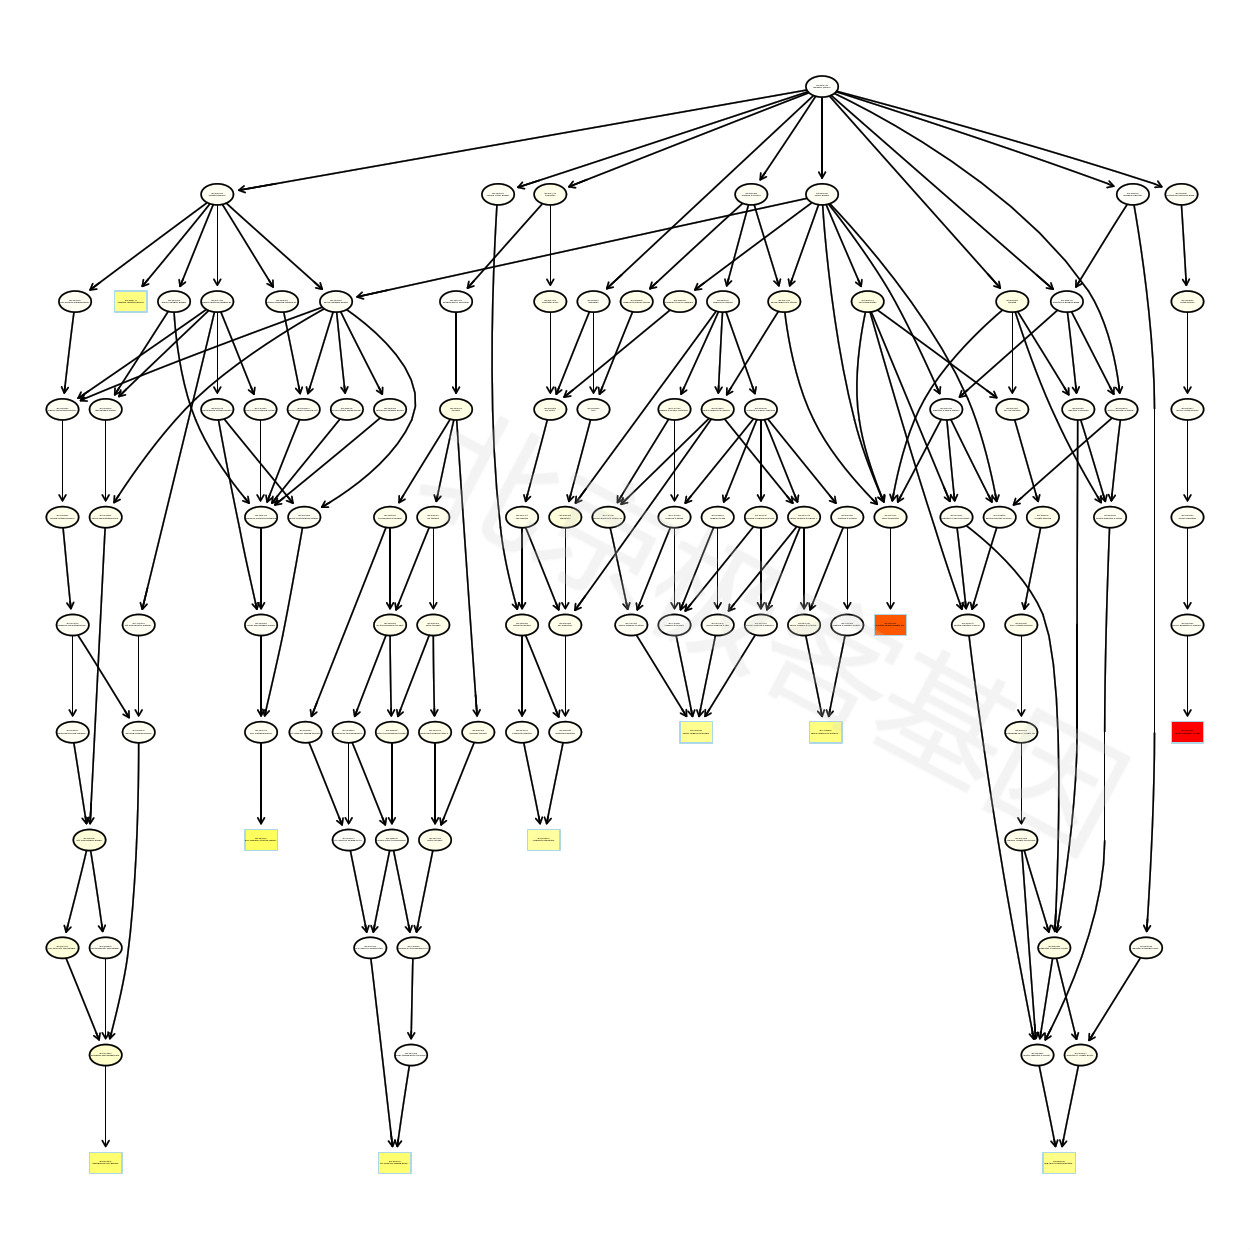
Figure 6.1: GO Nodes for BP (C vs. T)
PDF 文件 : cdf_C_vs_T_BP_GONodes.jpg
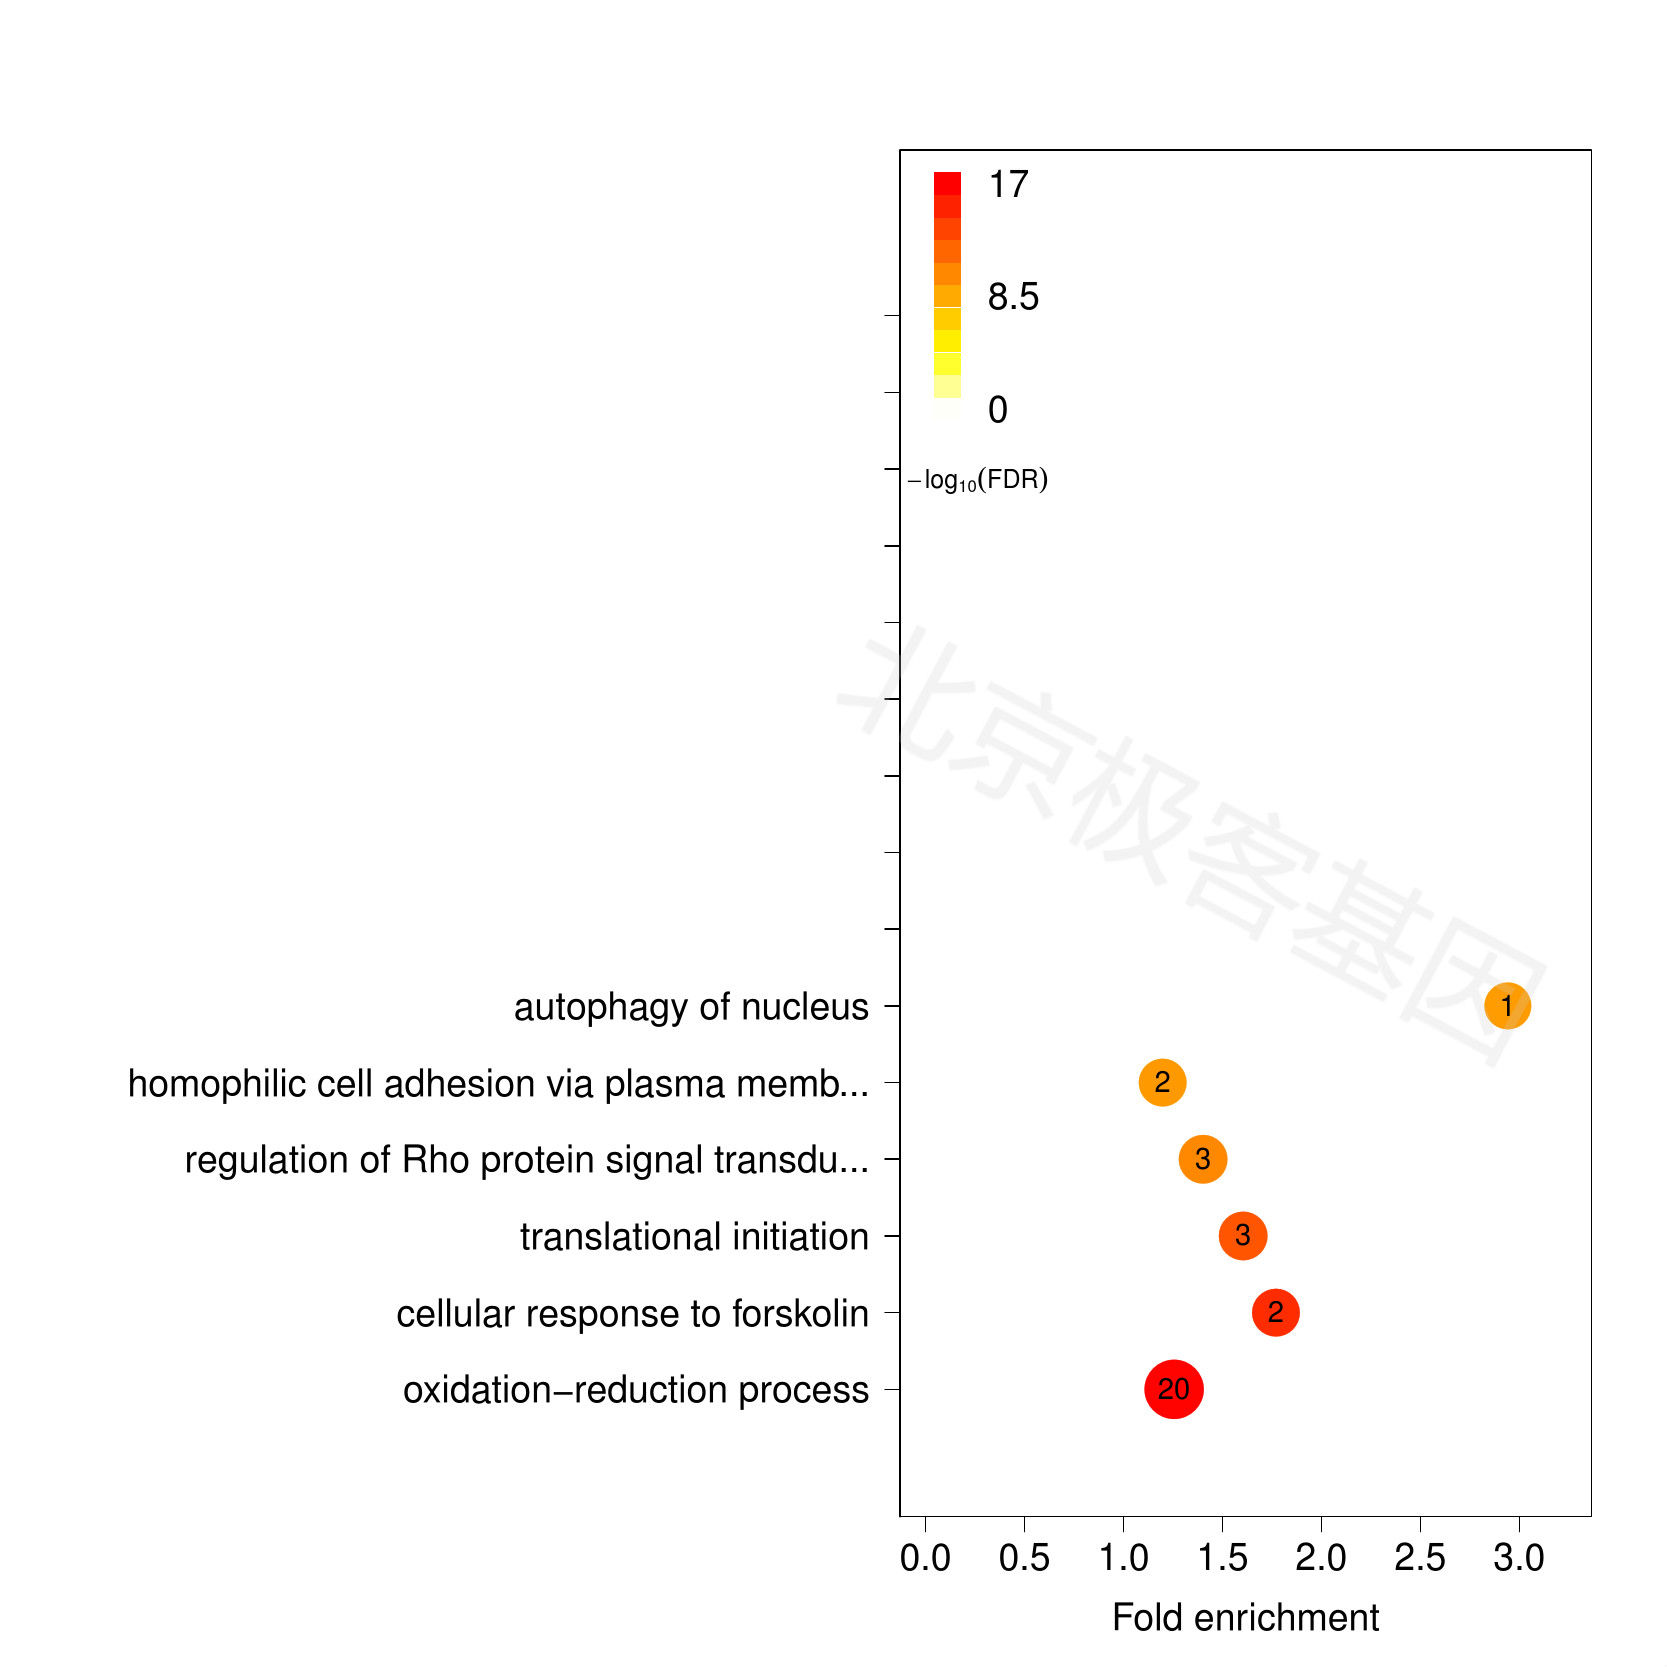
Figure 6.2: GOsummary for BP (C vs. T)
PDF 文件 : cdf_C_vs_T_BP_GOsummary.jpg
表格下载[Download Table] : cdf_C_vs_T_BP_GOsummary.xls
- Molecular Function (MF)
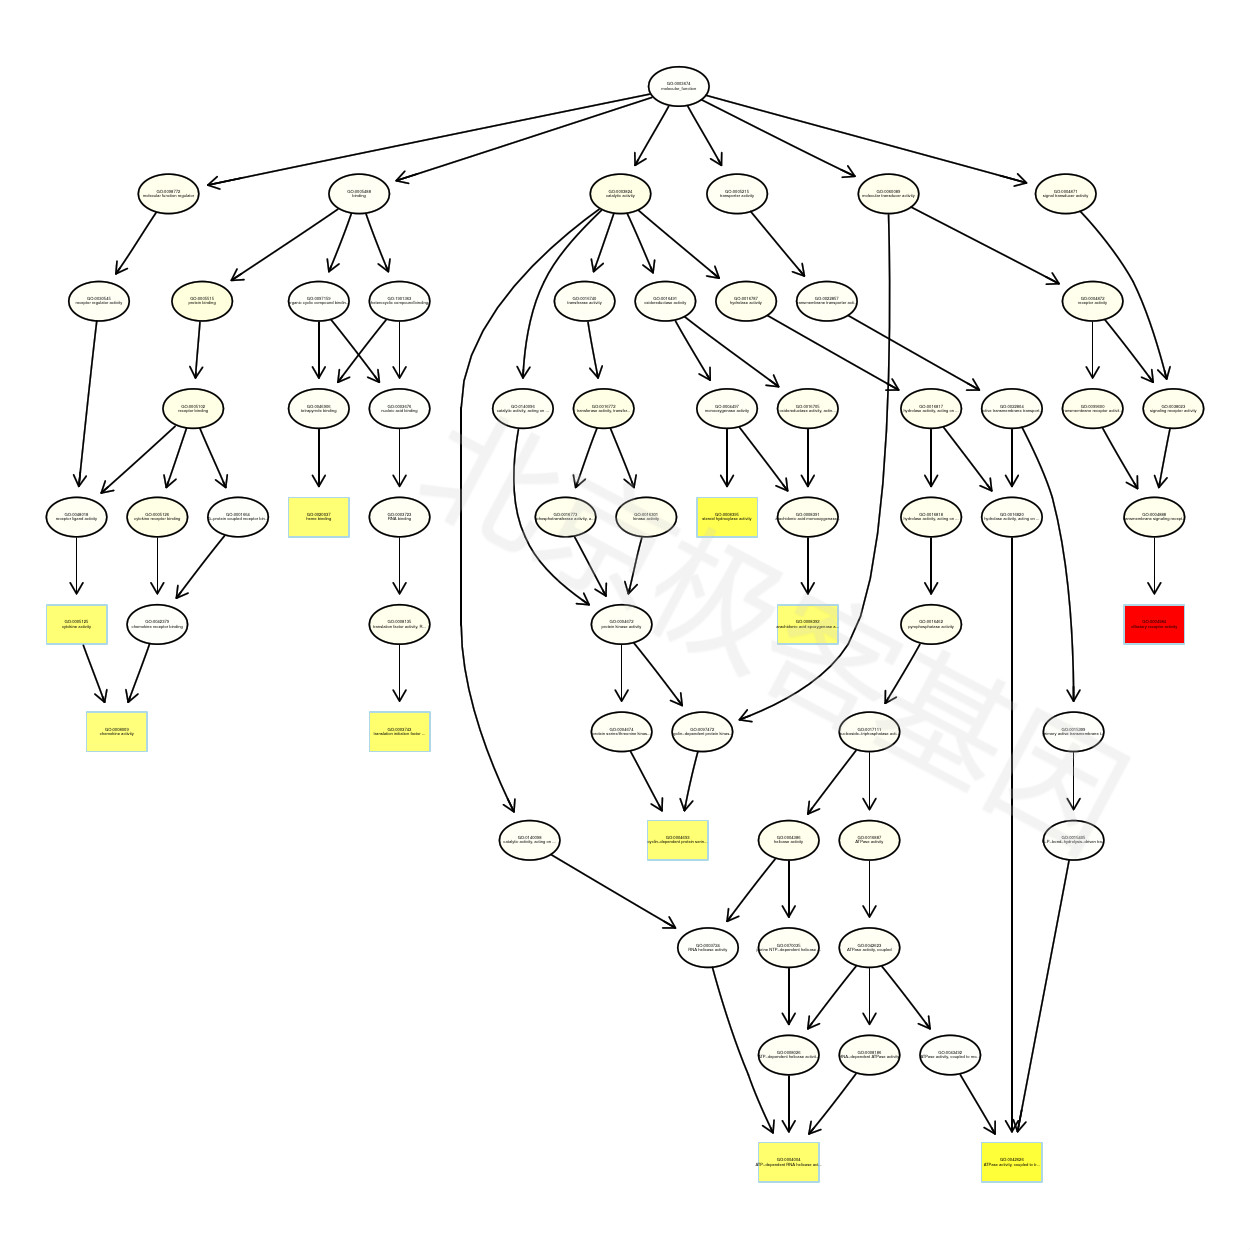
Figure 6.3: GO Nodes for MF (C vs. T)
PDF 文件 : cdf_C_vs_T_MF_GONodes.jpg
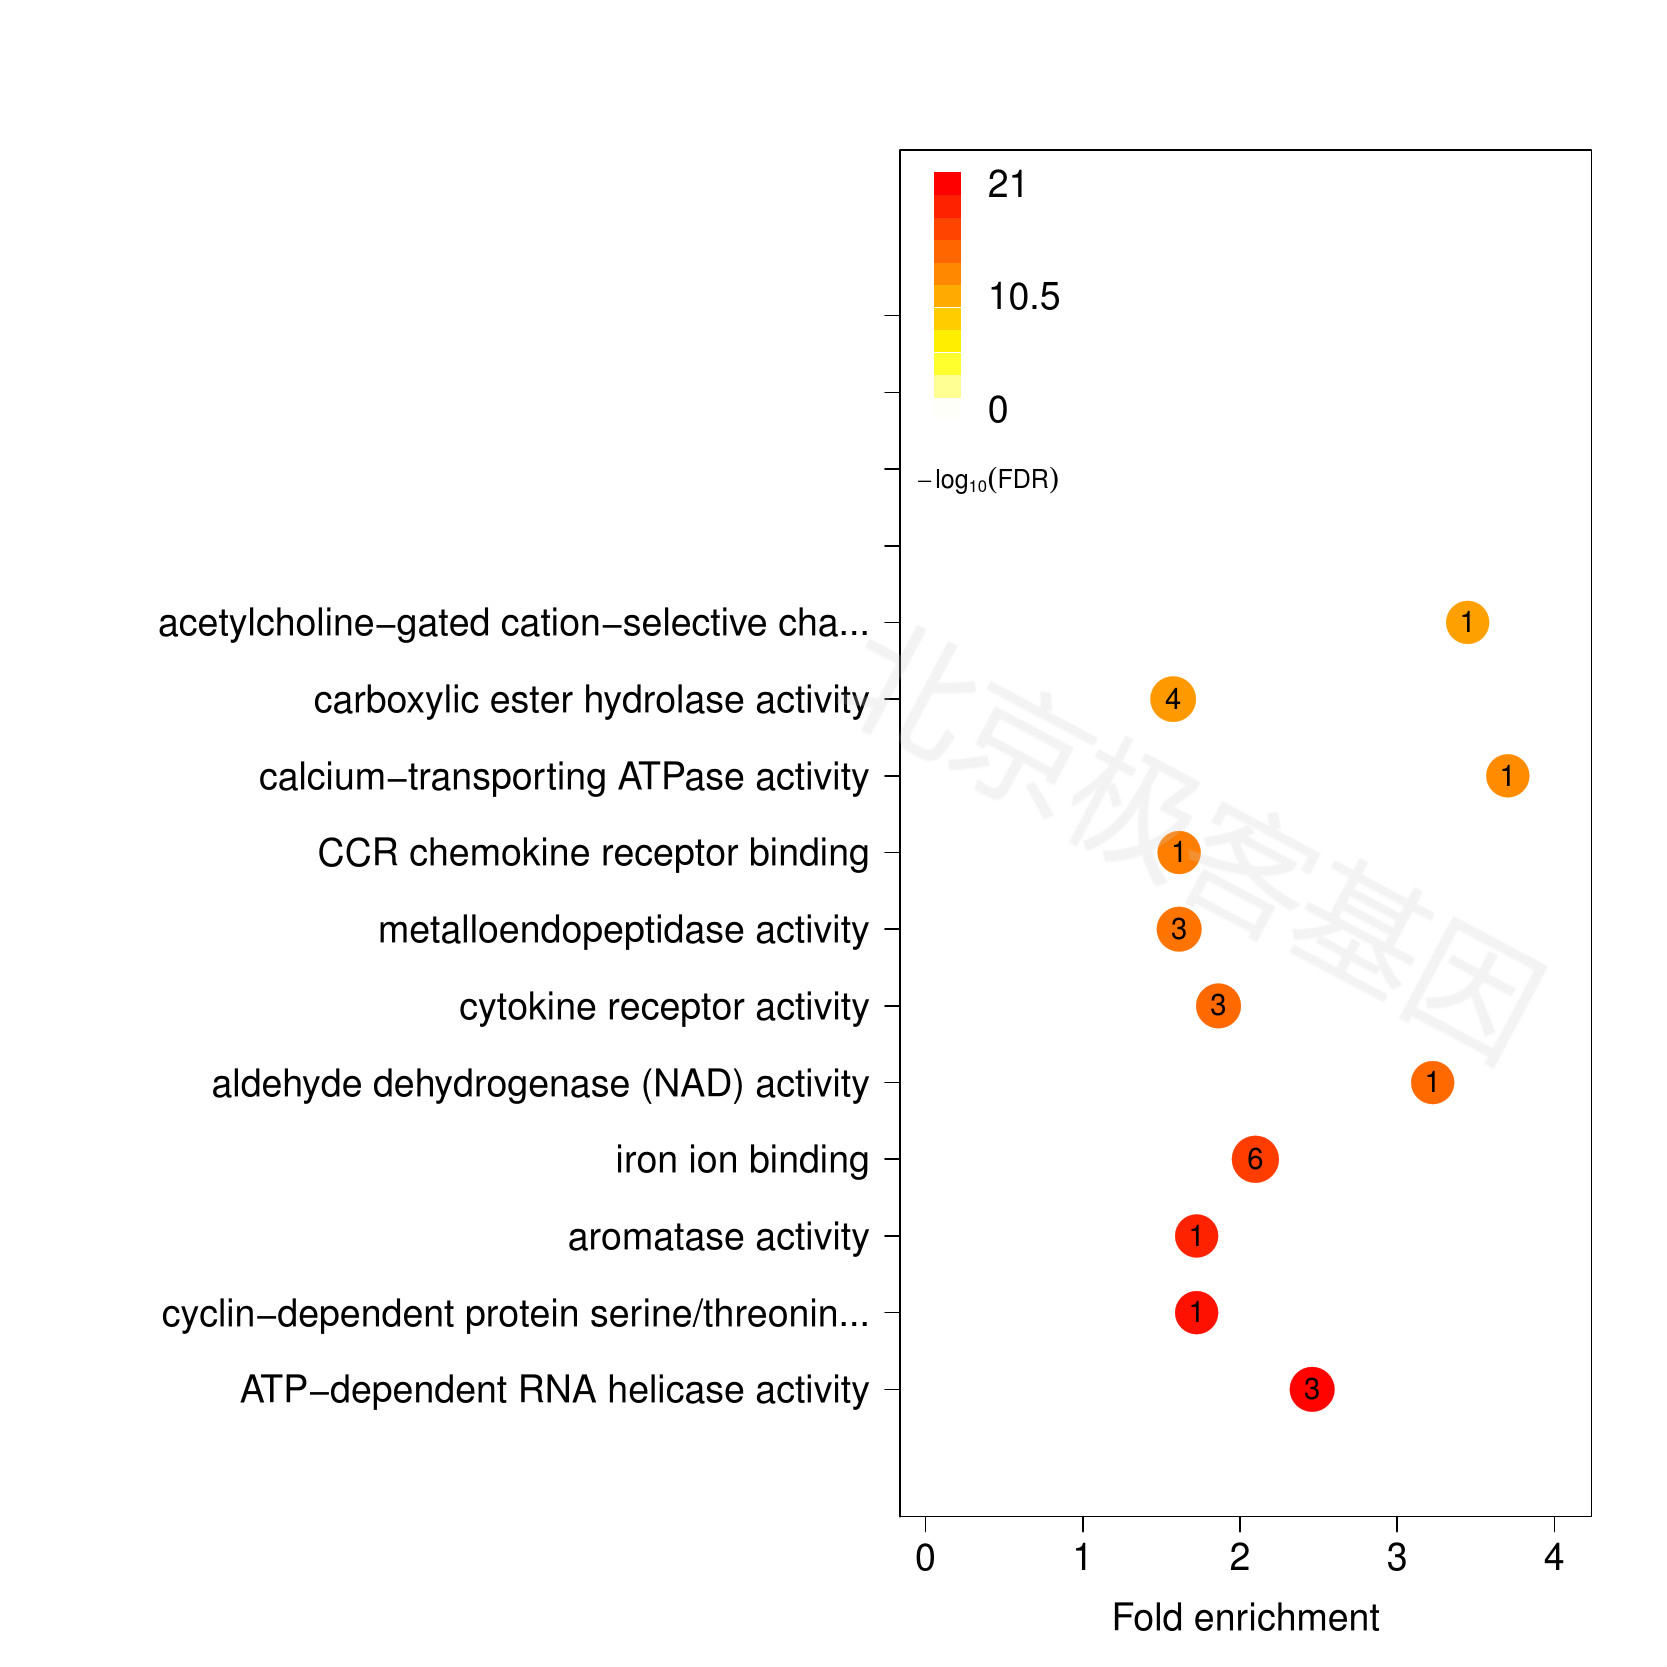
Figure 6.4: GOsummary for MF (C vs. T)
PDF 文件 : cdf_C_vs_T_MF_GOsummary.jpg
表格下载[Download Table] : cdf_C_vs_T_MF_GOsummary.xls
- Cellular Component (CC)
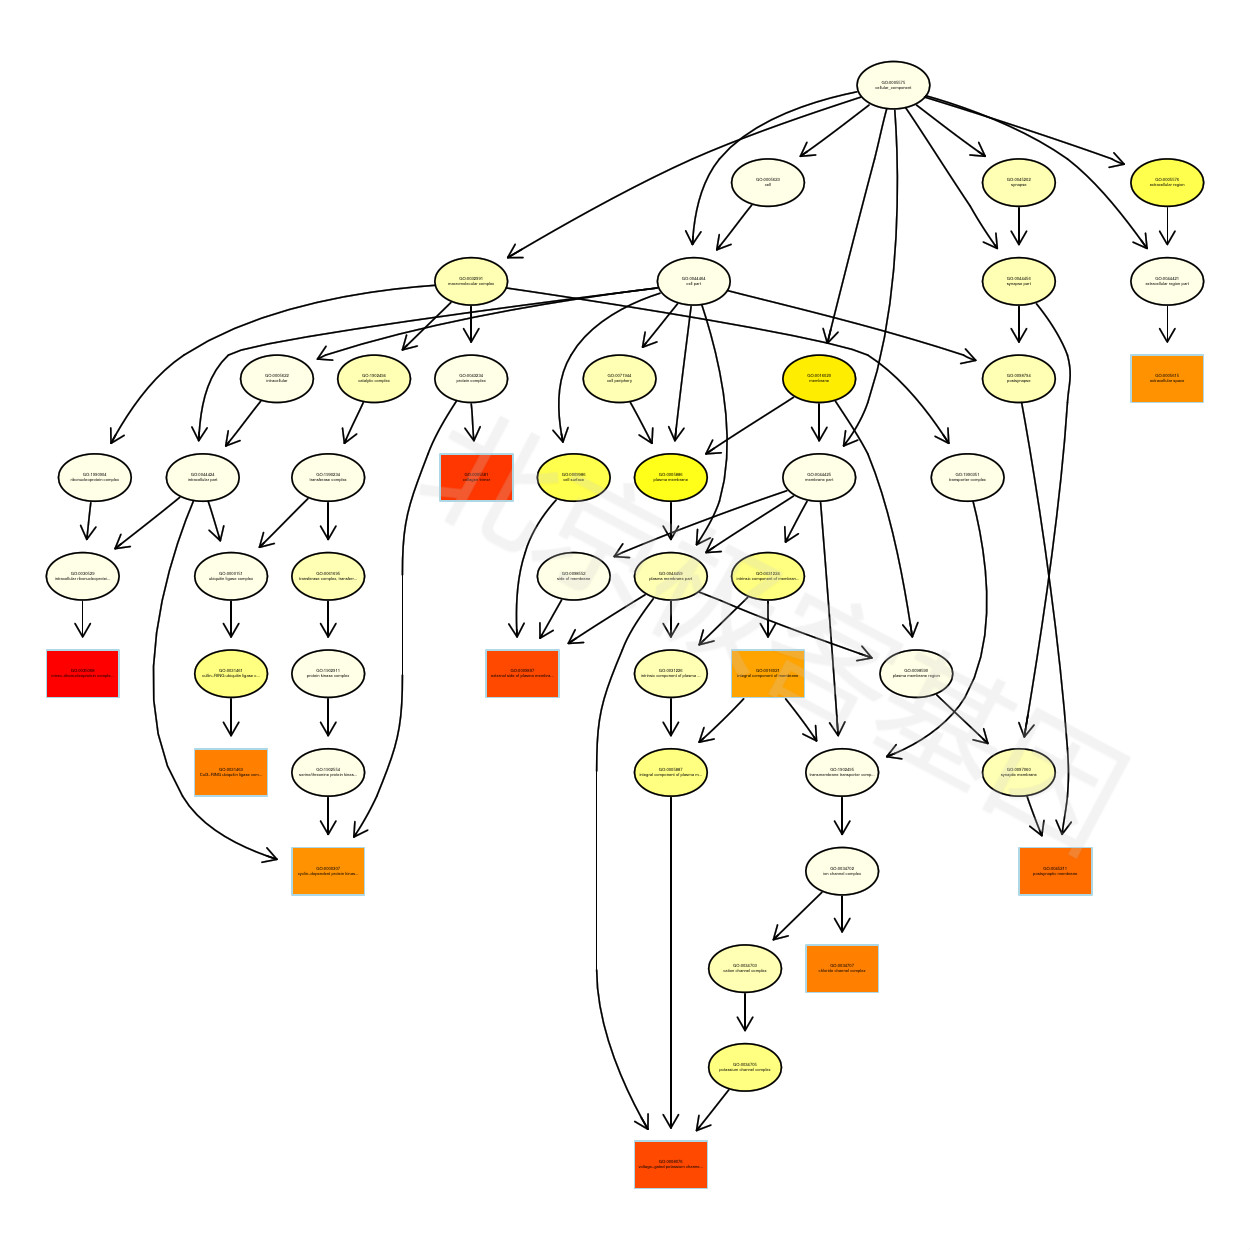
Figure 6.5: GO Nodes for CC (C vs. T)
PDF 文件 : cdf_C_vs_T_CC_GONodes.jpg
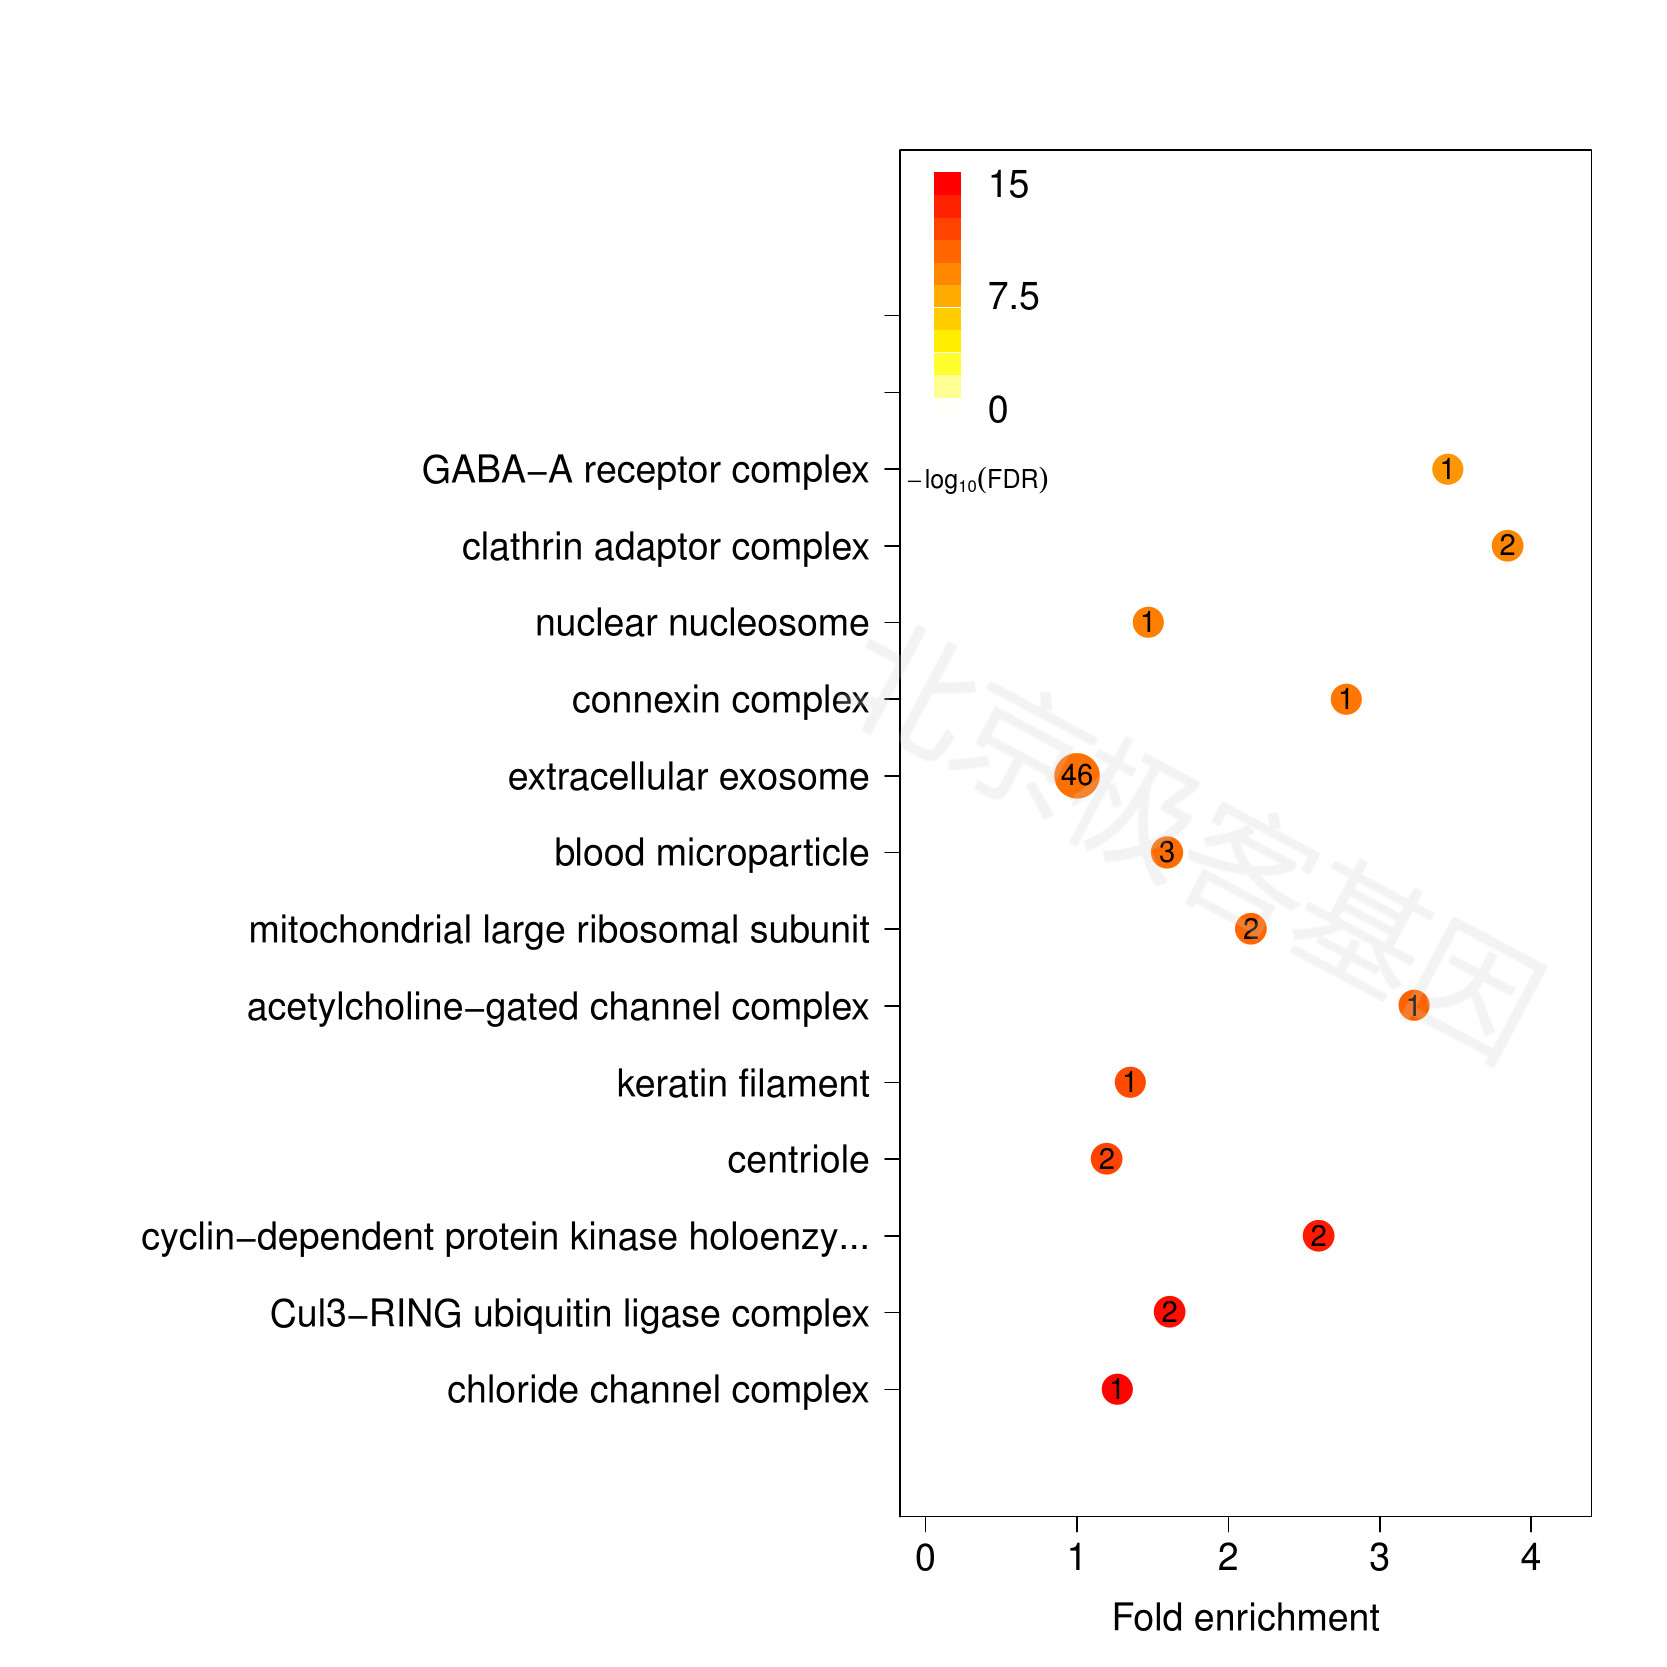
Figure 6.6: GOsummary for CC (C vs. T)
PDF 文件 : cdf_C_vs_T_CC_GOsummary.jpg
表格下载[Download Table] : cdf_C_vs_T_CC_GOsummary.xls
